
Page 168 -
P. 168
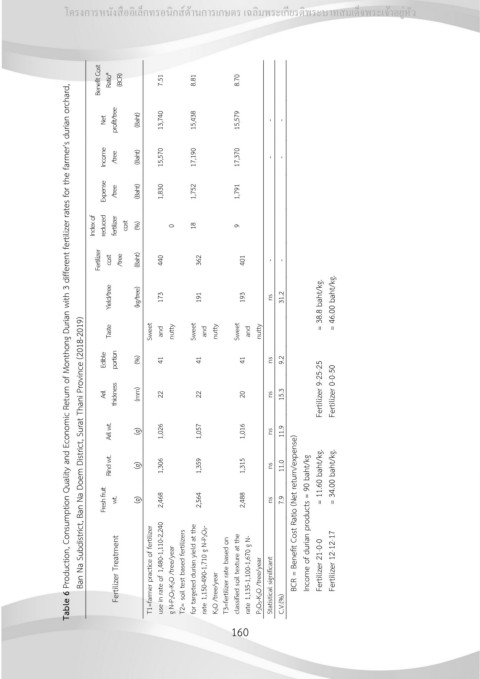
Table 6 Production, Consumption Quality and Economic Return of Monthong Durian with 3 different fertilizer rates for the farmer's durian orchard,
                        Ban Na Subdistrict, Ban Na Doem District, Surat Thani Province (2018-2019)
                                                                                                               Index of
                                                                                                      Fertilizer                                  Benefit Cost
                                          Fresh fruit   Rind wt.   Aril wt.   Aril   Edible   Taste   Yield/tree   cost   reduced   Expense    Income   Net   Ratio*
                    Fertilizer Treatment    wt.                      thickness   portion               /tree   fertilizer   /tree   /tree   profit/tree   (BCR)
                                                                                                                cost
                                            (g)      (g)      (g)     (mm)     (%)           (kg/tree)   (Baht)   (%)   (Baht)   (Baht)   (Baht)
                 T1=farmer practice of fertilizer                                    Sweet
                 use in rate of 1,480-1,110-2,240   2,468   1,306   1,026   22   41   and     173       440             1,830   15,570   13,740     7.51
                 g N-P2O5-K2O /tree/year                                             nutty                       0
                 T2= soil test based fertilizers
                 for targeted durian yield at the   2,564   1,359   1,057   22   41   Sweet   191       362      18     1,752   17,190   15,438     8.81
                 rate 1,150-490-1,710 g N-P2O5-                                       and
                 K2O /tree/year                                                      nutty
                 T3=fertilizer rate based on
                 classified soil texture at the   2,488   1,315   1,016   20   41    Sweet    193       401      9      1,791   17,370   15,579     8.70             โครงการหนังสืออิเล็กทรอนิกส์ด้านการเกษตร เฉลิมพระเกียรติพระบาทสมเด็จพระเจ้าอยู่หัว
                 rate 1,135-1,100-1,670 g N-                                          and

            160
                 P2O5-K2O /tree/year                                                 nutty
                 Statistical significant     ns      ns       ns       ns      ns              ns        -                        -        -
                 C.V.(%)                    7.9     11.0     11.9     15.3     9.2            31.2       -                        -        -
                       BCR = Benefit Cost Ratio (Net return/expense)
                       Income of durian products = 90 baht/kg
                       Fertilizer 21-0-0     = 11.60 baht/kg.     Fertilizer 9-25-25    = 38.8 baht/kg.
                       Fertilizer 12-12-17    = 34.00 baht/kg.     Fertilizer 0-0-50     = 46.00 baht/kg.