
Page 33 -
P. 33
โครงการรวบรวมและจัดทําวารสารอิเล็กทรอนิกส์ มหาวิทยาลัยเกษตรศาสตร์
วารสารวนศาสตร 31 (3) : 25-35 (2555) 31
์
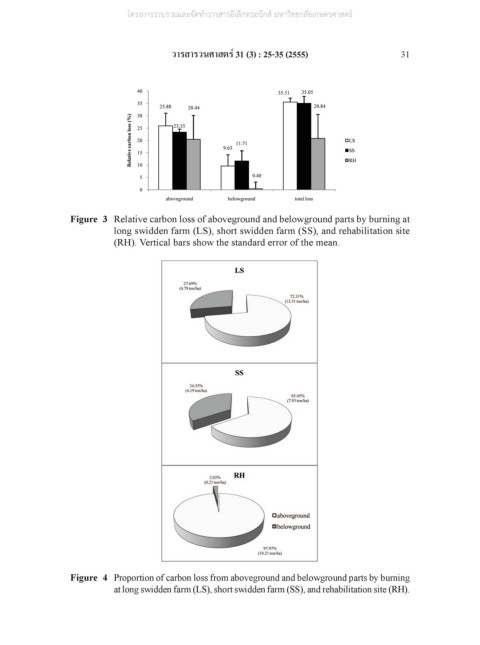
Figure 3 Relative carbon loss of aboveground and belowground parts by burning at
long swidden farm (LS), short swidden farm (SS), and rehabilitation site
(RH). Vertical bars show the standard error of the mean.
Figure 4 Proportion of carbon loss from aboveground and belowground parts by burning
at long swidden farm (LS), short swidden farm (SS), and rehabilitation site (RH).